Weekly Sales Reporting Automation
A Weekly Sales Report Generator automatically pulls data from your CRM systems, analyzes sales performance across regions and products, creates visual charts and summaries, and delivers comprehensive reports to your team every week. It's like having a dedicated analyst who never misses a deadline and always provides consistent, actionable insights.
Quick Overview
A Weekly Sales Report Generator automatically pulls data from your CRM systems, analyzes sales performance across regions and products, creates visual charts and summaries, and delivers comprehensive reports to your team every week.
Automatic data collection
Pulls from CRM systems without manual export/import
Consistent formatting
Standardized reports every week with the same structure
Scheduled delivery
Reports arrive in inboxes automatically on your preferred schedule
Visual insights
Charts, graphs, and trend analysis included automatically
Key Benefits
Setting Up Your Sales Report Generator
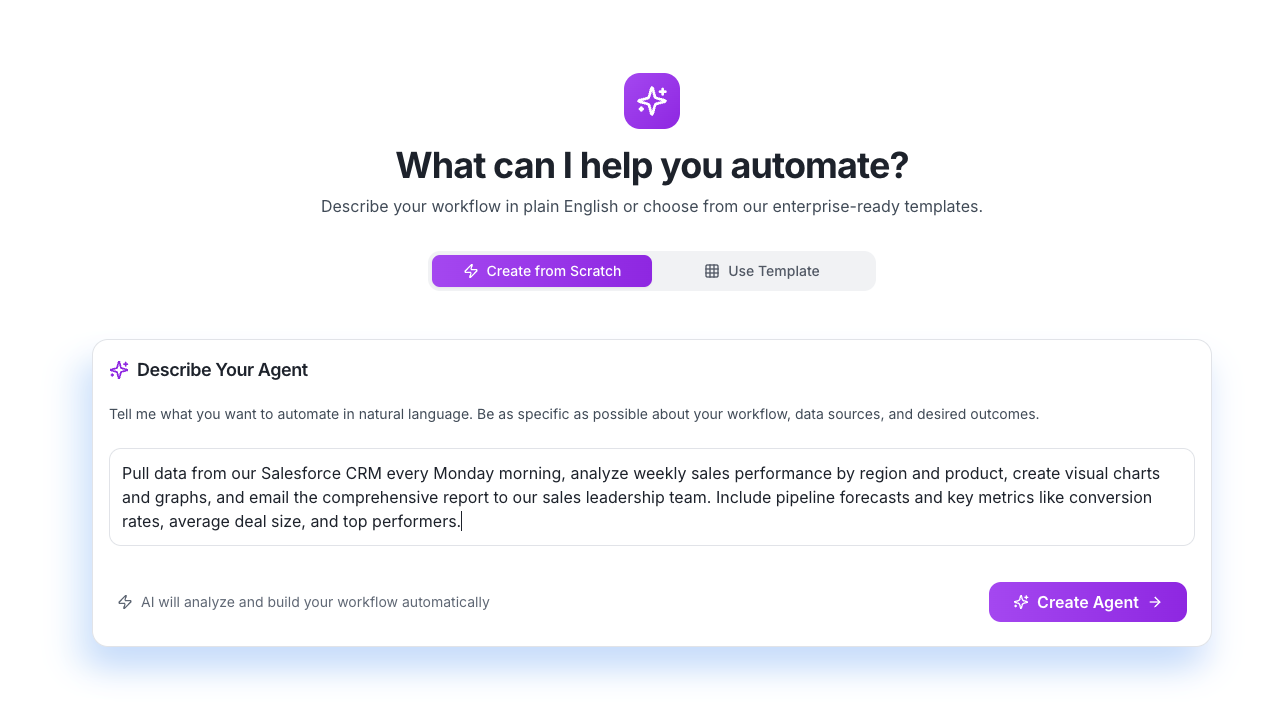
Describe Your Sales Reporting Needs
Start by telling Mica exactly what kind of sales reports you need. Mica's conversational interface makes it simple to describe your requirements in plain English.
Sample Description
Mica Connects Your Data Sources
Based on your description, Mica automatically identifies and connects to your CRM and other data sources. You don't need to configure APIs or set up integrations manually.
CRM Integration
Mica securely connects to Salesforce, HubSpot, or other CRM systems to access deal data, pipeline information, and sales metrics.
Data Processing
Automatically processes and analyzes sales data to identify trends, calculate key metrics, and generate insights.
Configure Report Structure Through Chat
Tell Mica exactly what you want included in your reports. It will create the report template, configure charts and visualizations, and set up the data analysis automatically.
Sample Chat Conversation
You: "Include a summary of total revenue, number of deals closed, and conversion rates by sales rep."
Mica: "Perfect! I'll create a performance dashboard showing individual rep metrics with revenue totals, deal counts, and conversion percentages. Should I also include comparisons to previous weeks?"
You: "Yes, and add a chart showing our pipeline progression over the last 4 weeks."
Mica: "Great! I'm adding a pipeline trend visualization with 4-week historical data. Your report will include rep performance tables and pipeline progression charts."
Revenue Trends
Automatic chart generation for sales performance
Team Performance
Individual and team metrics comparison
Pipeline Analysis
Deal progression and forecasting insights
Set Delivery Schedule and Recipients
Mica handles email scheduling and delivery automatically. Just tell it when and who should receive the reports.
Sample Scheduling Instructions
You: "Send the report every Monday at 8 AM to our sales leadership team, and also post a summary in our #sales-updates Slack channel."
Mica: "Understood! I'll schedule automatic delivery every Monday at 8:00 AM to your sales leadership team via email, and post key highlights to the #sales-updates Slack channel. I can also send you a notification when each report is delivered."
Email Delivery
- • Automatic scheduling (daily, weekly, monthly)
- • Customizable recipient lists
- • Professional email formatting
- • PDF and Excel attachments
Slack Integration
- • Channel summaries with key metrics
- • Interactive charts and graphs
- • @mentions for important updates
- • Thread discussions on specific data points
Refine and Customize Through Ongoing Chat
After your first report is generated, you can easily make adjustments by chatting with Mica. No need to navigate complex settings or reconfigure integrations.
Common Refinement Requests
"Add a section showing our top 5 deals in the pipeline"
Mica adds pipeline detail section automatically
"Change the email delivery to Wednesday mornings instead"
Schedule updated immediately for next report
"Include more detailed breakdowns by product category"
Additional analysis sections created automatically
Business Use Cases by Role
Sales Leadership
Scenario: Sarah, VP of Sales, needs comprehensive weekly reports showing team performance, pipeline health, and forecast accuracy to present to the executive team.
What Sarah tells Mica:
"Create a weekly executive sales summary with team performance metrics, pipeline progression, forecast vs. actual comparisons, and highlight any deals at risk. Include charts showing trends over the last 6 weeks and send it to me every Sunday evening."
Business Impact: Data-driven executive presentations, 90% faster report preparation, improved forecast accuracy through consistent tracking.
Sales Operations
Scenario: Mike, Sales Operations Manager, needs detailed pipeline analysis with stage progression rates, bottleneck identification, and accurate revenue forecasting.
What Mike tells Mica:
"Analyze our sales pipeline weekly, show conversion rates between stages, identify deals that have been stuck too long, calculate velocity metrics, and provide rolling 3-month revenue forecasts. Alert me when conversion rates drop below historical averages."
Business Impact: 15% improvement in forecast accuracy, early identification of pipeline bottlenecks, proactive deal management.
Regional Sales Managers
Scenario: Lisa, West Coast Sales Manager, needs detailed territory analysis showing individual rep performance, account health, and regional competitive insights.
What Lisa tells Mica:
"Track performance for my West Coast team weekly, show each rep's numbers against quota, identify accounts that need attention, analyze win/loss patterns, and benchmark our region against other territories. Send this to my team every Monday morning."
Business Impact: Improved rep coaching effectiveness, 25% increase in quota attainment, better account management strategies.
Expected Outcomes & ROI
Quantitative Benefits
Qualitative Benefits
Data-Driven Decision Making
Consistent, accurate data enables better strategic decisions and performance insights.
Enhanced Team Alignment
Everyone receives the same metrics and insights simultaneously, improving coordination.
Faster Response to Trends
Immediate alerts and consistent reporting enable quick responses to market changes.
Improved Sales Performance
Better visibility into performance metrics drives accountability and improvement.
ROI Calculation Example
For a sales team with $20M annual revenue:
Integration Capabilities
Mica automatically connects with your existing sales and business systems through its conversational interface. Simply mention the systems you use, and Mica handles the technical integration.
CRM & Sales Systems
- Salesforce: Deal data, opportunity tracking, pipeline metrics
- HubSpot: Contact management, deal progression, sales activities
- Pipedrive: Sales pipeline, activity tracking, forecasting
- Microsoft Dynamics: Customer data, sales performance, territory management
Analytics & BI Platforms
- Tableau: Advanced visualization, custom dashboards
- Power BI: Interactive reports, real-time analytics
- Looker: Data modeling, embedded analytics
- Google Analytics: Website performance, conversion tracking
Communication Tools
- Slack: Channel notifications, interactive reports, team alerts
- Microsoft Teams: Channel posts, file sharing, collaborative discussions
- Email: Automated delivery, formatted reports, PDF attachments
- Discord: Server notifications, scheduled updates
Data Storage & Processing
- Google Sheets: Collaborative spreadsheets, real-time updates
- Excel Online: Formatted reports, pivot tables, charts
- Data Warehouses: Historical data access, complex queries
- APIs: Custom integrations, real-time data sync
Advanced Customizations
Smart Report Personalization
Tell Mica to create different versions of reports for different audiences, all from the same data:
Executive Summary
"Create a high-level summary for executives with key metrics and trends"
Manager Details
"Include detailed team performance data for sales managers"
Rep Performance
"Show individual metrics and goals for each sales representative"
Dynamic Alert System
Mica can proactively notify you when important metrics change or thresholds are reached:
Sample Alert Instructions
"Send me an immediate Slack message if weekly revenue drops more than 15% from the previous week, or if any sales rep falls below 60% of their monthly quota with less than a week remaining in the month."
Mica monitors your data continuously and sends intelligent alerts based on your specific criteria.
Competitive Analysis Integration
Enhance your sales reports with competitive intelligence and market context:
"Include a section comparing our win rates against each major competitor, and highlight any changes in competitive landscape from deal notes and loss reasons."
Mica analyzes CRM data to identify competitive patterns and market trends automatically.
Ready to build your first agent?
Join teams that have already automated their most tedious tasks with Mica AI. Get started in minutes, not months.